As the world’s most populous nation, changes in the way India is growing deeply affect the world. Yet, these key shifts are not adequately documented or discussed, both within India and globally.
At Data For India, we track these changes closely, using high-quality Indian and global data sources: the United Nations World Population Prospects, 2024 Revision, for global data and population projections from India’s 2011 Census, the Sample Registration System and the National Family Health Survey for Indian data.
Through this three-part series, we attempt to pull together vital Indian data on demographic shifts, place them within the context of other socio-economic changes taking place in India, and set them against a global backdrop. With this, we identify new areas of research as well as directions for policy and discussion.
In Part I, we bring together the data to describe the current moment and the key recent data points that we argue have gone relatively unnoticed. In Part II, we examine data around falling birth rates and share research that suggests that India is both an outlier and a part of a global trend. In Part III, we look at the data on demographic differences between Indian states and how it feeds into current socio-economic and political tensions.
Over the last few years, India has hit at least six key demographic milestones, moments of enormous significance in global demography, development, and growth.
1. Becoming the world’s most populous nation
In the early 2020s, India surpassed China to become the largest country by population, with 1.4 billion people.
There is little doubt that this is a populous nation, and will continue to be for several more decades. At its peak in the early 2060s, India is projected to have 1.7 billion people. It is expected to continue to be the world’s most populous country until beyond 2100, which is the furthest year out for which population projections have been made.
The absolute size of India’s population tends to make other countries look like also-rans in comparison. But other large nations, including Nigeria and Pakistan, are growing too. As a result, India’s share of world population is expected to peak by 2030, following which it is projected to decline.
While India’s population will continue to grow for the next 30 years, the pace of this growth has already slowed down significantly. In the early 1950s, the earliest years for which there is reliable and comparable data, and soon after Indian independence, India’s population was growing at well over 2% annually, while the world as a whole was growing at about 1.75% annually. In the three decades after Independence, India’s population had doubled.
Starting in the 1980s, population growth began to slow down. By 2020, India’s annual population growth had fallen below 1% annually, and is now expected to comprehensively fall below the world’s population growth rate on average over the next few years. This gap is expected to keep growing as India’s population growth rate slows further.
At the turn of the millennium, India was adding nearly 20 million people annually to its population. This number then began to decline in absolute terms, and by 2024, India was adding under 13 million people annually. As this trend continues, India is expected to stop adding new people by 2060, after which its population will begin to decline in absolute numbers.
This slowing down of population growth is happening across the country. However, there are two distinct speeds to this slowdown.
Historically, India’s southern and western states have been richer and have achieved better development outcomes, including on women’s education and women’s health. As a result, there is a marked difference in the demographic trajectories of the southern and western states, and the eastern and northern states, which are poorer and less developed.
Until the 1970s, population growth rates across Indian states were quite similar. However, since the 1980s, India’s southern states have been growing far slower than the central, northern, and eastern states. For instance, in Kerala – India’s most developed state, located in the south – annual population growth fell below two percentage points in the 1970s.
In Bihar – one of India’s least developed states, located in the eastern Gangetic plains – annual population growth is projected to have fallen below two percentage points only in the late 2010s, forty years after Kerala.
What this means is that the states where population growth remains relatively high will account for a higher share of India’s population in the future. Over one-third of the total increase in India’s population between 2011 and 2036 will have come from two states alone – Uttar Pradesh and Bihar – while all of the southern Indian states will have seen their share in the population declining (Part III of this series discusses that schism in greater detail).
2. Fertility falling below replacement
Driving this slowdown in population growth is a dramatic decline in birth rates.
The Total Fertility Rate (TFR) is the average number of children that a woman is likely to have in her lifetime. As countries get richer and women get better access to healthcare and education, fertility rates begin to fall – a phenomenon seen across the world.
When a country’s TFR drops to 2.1, meaning that women will have an average of 2.1 children over their lifetimes, demographers say that the country has reached “replacement fertility”. What this means is that if two adults have a notional 2.1 children between them, then, accounting for some likelihood of death during childhood or adolescence, that couple will produce two adults, and the size of the population will remain the same. This is a key milestone in a country’s demographic journey. If fertility falls below that level, the population will begin to decline in absolute numbers.
After being high in the early decades after Independence, India’s TFR has fallen rapidly and, according to the latest official Indian data, is now well below the replacement level, down to 1.9. The fertility rate is higher in rural than in urban India; however even in rural India, fertility has now reached replacement levels.
Although fertility is falling everywhere, there are substantial differences between states within India. Across the southern and western states, TFR is well below replacement level. In these states, levels of fertility are as low as in countries in the developed world. The fertility rate of the state of Maharashtra in the west, with Mumbai as its capital, for instance, is lower than that of Norway (Part II of this series examines the fertility discussion in greater detail).
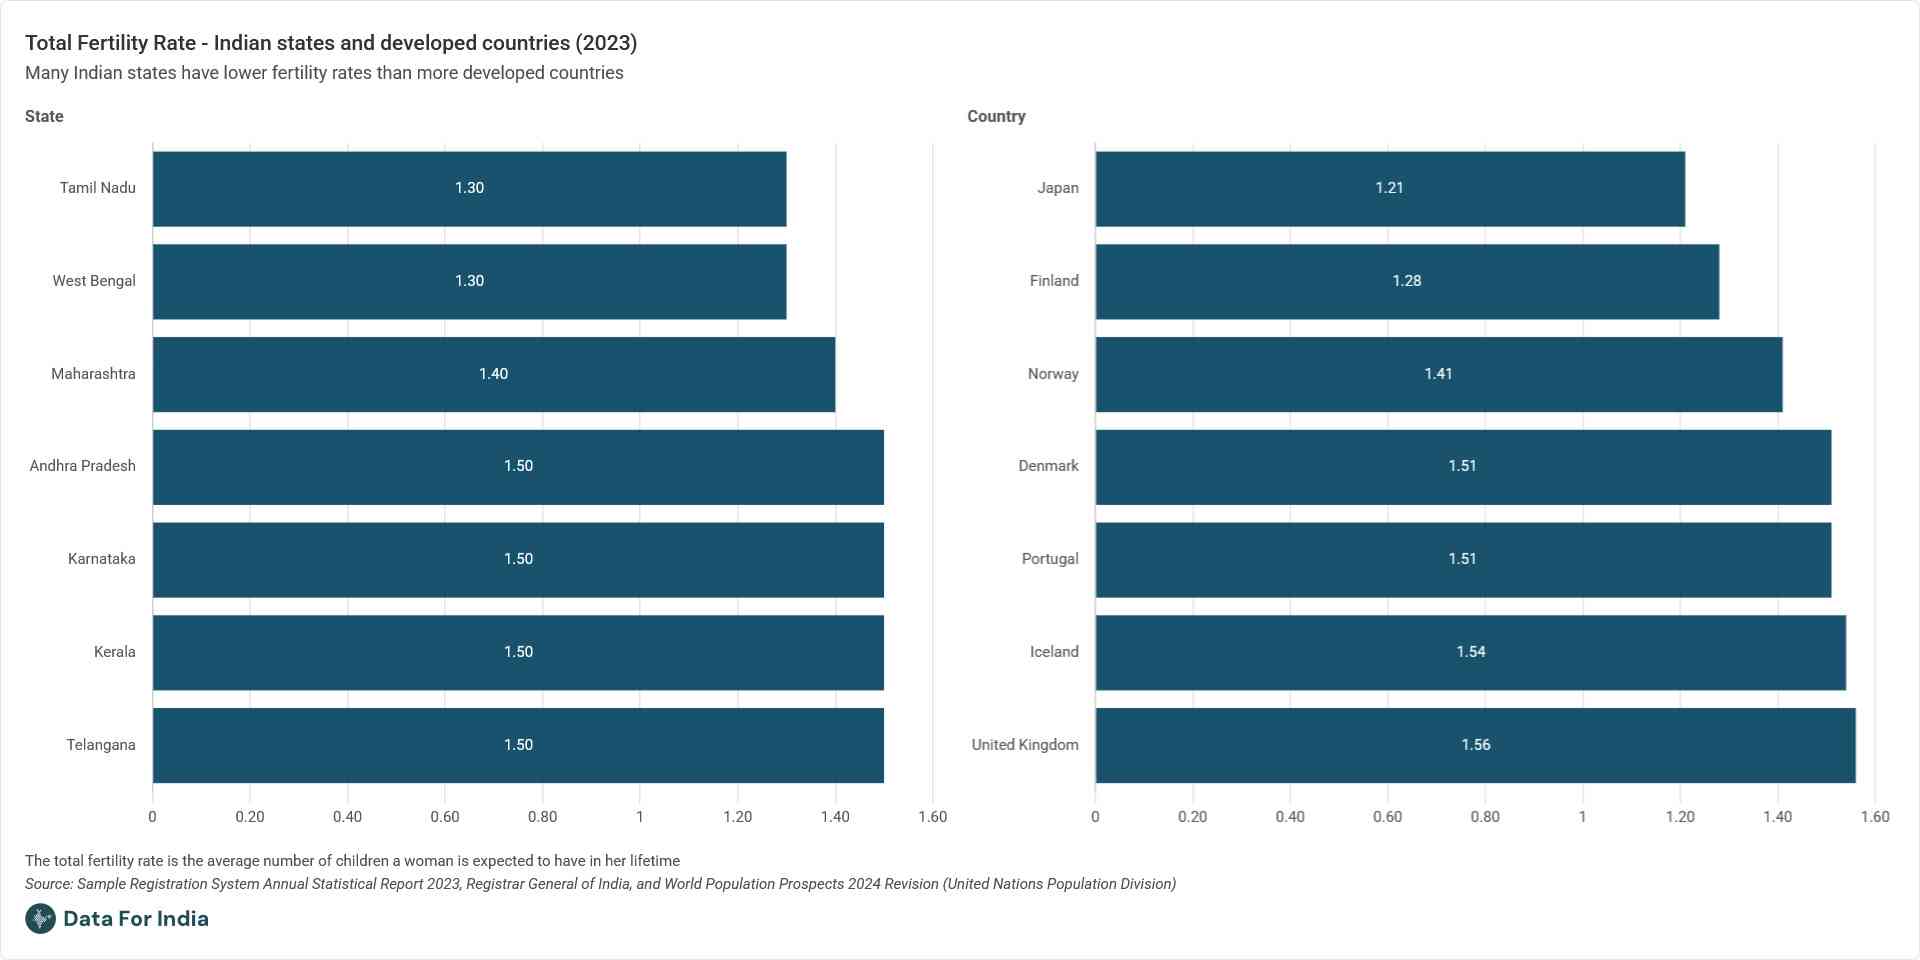
Fertility has also fallen in the northern and eastern states that have historically had higher levels of fertility. Even in Bihar, India’s highest fertility state, TFR is now below 3.0 children per woman.
Yet, this continuing gap in the fertility rates of northern and southern states is a key faultline in Indian politics. The TFR in rural Bihar, Uttar Pradesh, Madhya Pradesh, and Chhattisgarh is still above 2.5 children for every woman, while the TFR in even the rural parts of more developed states is now below replacement level.
3. Declining child population
As a result of this sharp fall in birth rates, the absolute number of babies born every year in India began to decline from the early 2000s. The number of babies born every year in India peaked at around 29 million at the turn of the millennium, following which it began to fall. This has meant a sharp decline in India’s child population, in both absolute and relative terms.
In the early 1960s, 40% of India was under the age of 14. By 2025, this number was cut in half. In another two decades, there will be more seniors over the age of 60 than there will be children in India.
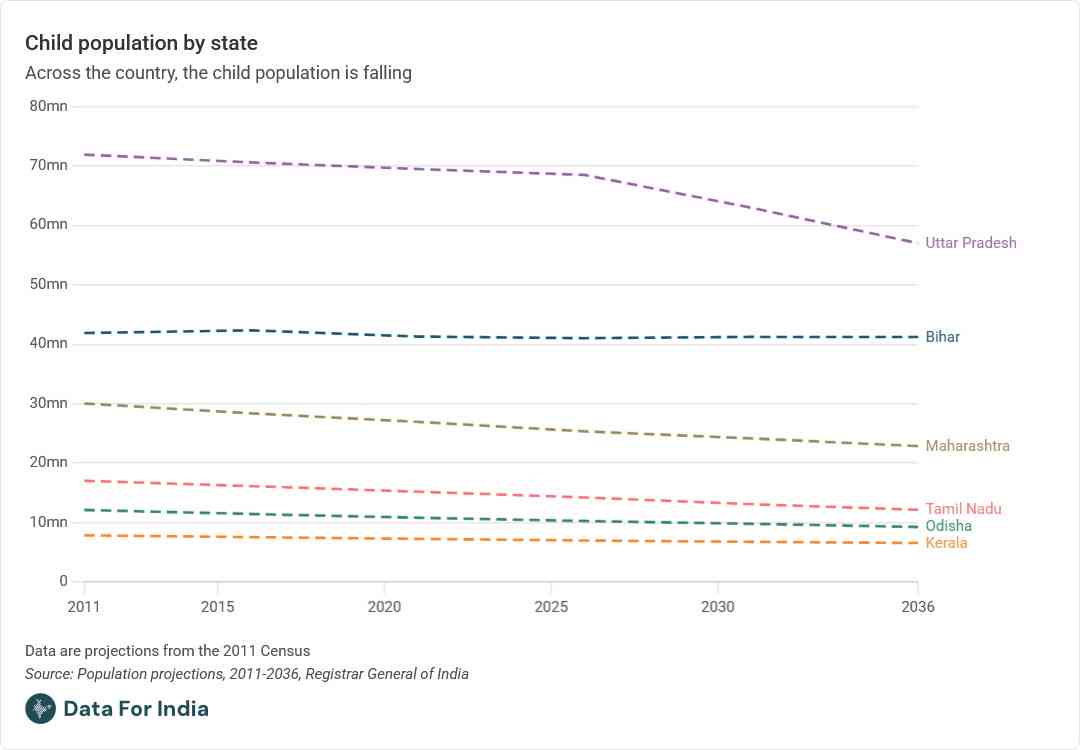
Despite the differences in the socio-economic and demographic conditions of Indian states, the decline in the child population is taking place across the country.
India’s northern states have far larger child populations, both in absolute terms as well as a share of their populations, as a result of a relatively delayed decline in fertility rates. One in every three Indian children (under the age of 14) lives in two states alone – Bihar and Uttar Pradesh. Yet, both India’s poorer and richer states are seeing their child populations steadily decline over the last decade.
4. Demographic window closing
In an influential 2003 paper, economist and demographer David E Bloom and his co-authors coined the term “demographic dividend” to refer to a boost in economic growth that a country with a large share of its population in the working age can expect to benefit from, provided the right policies are in operation.
This term has been used repeatedly for India in the context of its large youth population. Half of India’s population is under the age of 30, making it a far younger country than its European, North American, and East Asian counterparts. The median American or Chinese person, for instance, is over a decade older than the median Indian.
However, that demographic window for India is now closing. The share of Indians who are aged 15-64 years – what is defined as a “working-age population” according to demographic and labour statistics – will peak in the next two or three years, according to UN population projections.

This has profound implications. For one, there is the past to study. Was India able to extract the projected “dividend” from its working-age population bulge?
And then there is the future to think of.
One key indicator tracked by demographers and economists is the dependency ratio – the ratio of dependents (those who cannot work as they are either children or the elderly) to the working-age population. In states or countries with a higher dependency ratio, there is a greater financial burden on the working-age population and the state to provide welfare.
Combining India’s large working-age population with a shrinking child population has led to a decline in the country’s dependency ratio. By 2026, India’s dependency ratio is projected to be 543, meaning that there will be 543 children and elderly people for every 1,000 people of working age.
As India continues to age, the dependency ratio is set to start rising again, this time driven by its growing elderly population. But this will be unevenly spread. Since the northern and eastern states are seeing a gradual aging with birth rates only now declining, their dependency ratios are poised to fall, as the working-age population grows and is more able to support dependents. However, the southern and western states will see their dependency ratios rise steadily as their populations age and their workforces shrink.
5. The epidemiological transition
Across the world and over time, growth and development transform what people get sick and die from.
The World Health Organization splits the causes of death into three broad categories:
(i) communicable, maternal, perinatal, and nutritional conditions – these include vector-borne diseases like malaria, as well as deaths from conditions associated with pregnancy, childbirth, and early life.
(ii) non-communicable diseases – these include cardio-vascular diseases, cancers, and other diseases that do not spread through contact, air, or vectors.
(iii) injuries – these include homicides, self-harm, and road accidents.
When a group – either geographical or social – is at low levels of income with poor nutrition and low levels of access to a clean environment and healthcare, communicable diseases and conditions related to childbirth account for most deaths. As groups get richer and older, deaths from these causes become more preventable and less common. As a result, the relative share of deaths from non-communicable diseases such as heart disease and cancer begins to rise.
India is in the midst of this shift, a moment that in public health is called the epidemiological transition from communicable diseases and conditions surrounding childbirth to non-communicable diseases as the leading cause of mortality. This is reflected in significant gains in maternal outcomes, and a dramatic reduction in mortality from communicable diseases like malaria.
India’s richer states are further along in their epidemiological transition, having reached the point where non-communicable diseases account for the majority of deaths two decades ago. In India’s poorer states, on the other hand, the epidemiological transition is much more recent.

Communicable diseases still account for over 30% of deaths in India’s poorest states, while in India’s richer states, communicable diseases now account for fewer than 20% of deaths. Non-communicable diseases now account for over half of all deaths in both India’s less and more developed states, but the extent of mortality caused by non-communicable diseases is significantly higher in the richer states.
6. Mortality rising
From the 1950s to the early 2000s, India has seen a steady decline in its death rate (the number of people who die annually, proportionate to the population). Life expectancy in India has grown steadily over time – from being under 50 years in 1970 to over 70 today.
In the 1970s, when comparable data was available, Indian men lived longer than women. That male advantage was reversed in the early 1980s, and a girl born in the late 2010s could now expect to live nearly three years longer than a boy born in the same year.
The key driver of falling mortality in India has been the dramatic lowering of risks to the life of infants. Over half a million infants died in India in 2025. But the risk of dying in infancy and early childhood has fallen dramatically in India over the last 70 years. In the 1950s, more than one in three deaths in India were of infants under the age of one, and more than half of those dying every year were children under the age of five. Deaths in early childhood now account for fewer than one in ten deaths in India.
As a result of these large improvements in infant mortality, the relative risk of death in India is shifting to older age groups. In India’s poorest states, the risk of dying in infancy remains higher than the risk of dying at older ages. However, in its richest states, the burden of mortality has shifted to older age groups.
In Kerala, for instance, the Infant Mortality Rate has now fallen to 5 (five infant deaths for every 1,000 live births in a year), which is comparable to northern European countries. As a result, Kerala is now the first Indian state where the risk of death is lower for an infant than it is for the population as a whole. Kerala has all but removed the heightened risk that infancy bears in most of the developing world.
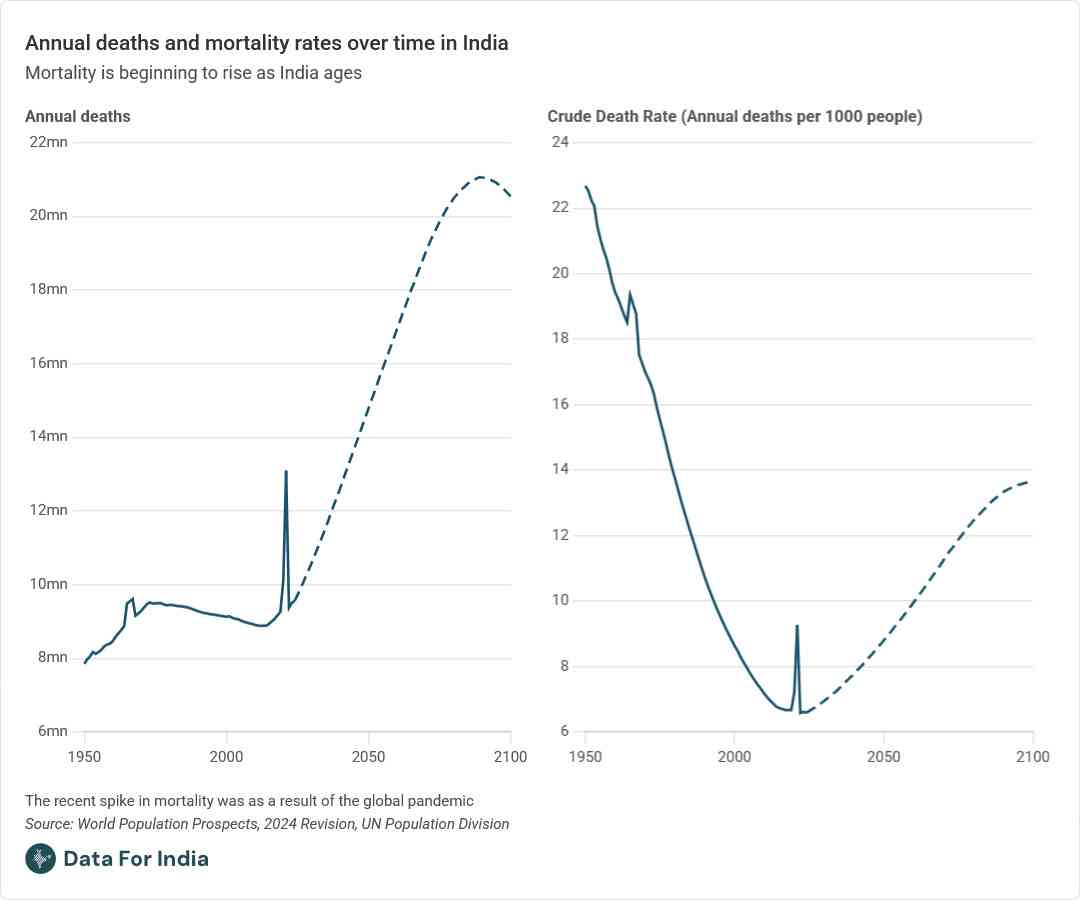
But as the whole country ages, mortality rates for the population as a whole have begun to rise again. After steadily falling since the 1950s, India’s Crude Death Rate – the number of estimated deaths every year relative to the population – rose sharply in 2020 and 2021 as a result of the Covid-19 pandemic.
By 2023, the Crude Death Rate had returned to pre-pandemic levels, but from 2024 onward, India’s Crude Death Rate is projected to rise, and to continue to rise every subsequent year for the projected future. In absolute terms as well, the number of annual deaths in India has been rising from the 2010s.
Conclusion and data cautions
Taken together, these six trends present a picture of a country at a complicated moment. While still growing in absolute terms, India’s share of the world’s population will soon begin to decline.
Fertility is falling far faster than the world has realised, and even within India, few understand the scale of the shift. The child population is in decline and the window for the demographic dividend is closing. Indians are living longer and healthier lives, but as the country ages, mortality rates will rise. All of these trends are further nuanced by the parallel realities of India’s richest and poorest states.
Yet public discussion – whether in large parts of Indian academia, the media, or politics – has not kept up with these changed realities. Despite evidence that falling birth rates should be a key demographic discussion, the “population explosion” discussion continues to dominate discussions.
The southern states in particular have much to grapple with: public health priorities that might have to look quite different from those of the union government, the need for government and market-led solutions for aging-related issues, and an overdue conversation around labour migration in light of their declining working-age populations. This is separate from the conversation around electoral representation that dominates most inter-state demographic discourse.
Through this series, we attempt first and foremost to bring data to the table. Demographic data for India suffers from some serious drawbacks. Since India has not had a Census since 2011, post-2011 data comes from projections made by India’s Registrar General of India, based on the 2011 Census. Our research shows that the further out in time they go from the base year, the more unreliable these estimates become.
Data on mortality also suffers from a lack of direct data. The most direct way to measure mortality would be if every death was registered, and attended to by a health professional who certified its cause. However, in low-income settings like India, this isn’t uniformly possible; not all deaths are registered with civil authorities, and the rates of death registration are lower still in poorer states.
To fill in these gaps India has a Sample Registration System which conducts a large, nationally representative sample survey every year in which enumerators visit households, enquire about deaths in the preceding year in that household, and produce estimates of national mortality. Most of our work relies on Sample Registration System data. However, there are systemic issues with mortality data from the Sample Registration System as well.
Incorporating our critical engagement with data sources and the source data into our analysis, we aim to take the conversation about India’s demographic dilemmas substantially forward.
Rukmini S is the founder of Data for India (where she leads research and writing) and a CASI Non-Resident Fellow. Her areas of focus include demography, health, and household economics. She has previously led data journalism in Indian newsrooms and is the author of Whole Numbers & Half Truths: What Data Can and Cannot Tell Us About Modern India (Westland, 2021).
The article was first published in India in Transition, a publication of the Center for the Advanced Study of India, University of Pennsylvania.
📰 Crime Today News is proudly sponsored by DRYFRUIT & CO – A Brand by eFabby Global LLC
Design & Developed by Yes Mom Hosting